IL. (ECWd) –
When the government publishes information behind the scenes that doesn’t match what they tell the public, it creates distrust. Even more concerning is when they refuse to respond to Freedom of Information Act requests and have to be sued to obtain public records, which one would think would validate claims being made by the government.
September 19, 2020, I filed a FOIA request to the Illinois Department of Public Health in order to validate the information leaked to us and later obtained through another FOIA request. Specifically, I wanted the source data that created the pie chart found on page 13 of this document which was published internally by IDPH.
On the left-hand side of page 13, it states, “Outbreaks by Type since July 1, 2020 (based on First Onset Date). What the government was attempting to claim was that they knew the source location of COVID cases, which they broke down in the pie chart.
At this stage of the COVID battle in this country, we have yet to see any evidence that can confirm the exact location people were infected, but all that aside, the numbers are either bogus or the claim that it represents outbreaks since July 1, 2020, is false.
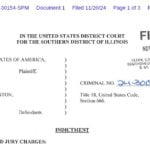
I waited 6 months before having to sue IDPH for the source data used to create the pie chart. A few months after filing suit, IDPH was provided an extension of time to answer the lawsuit and on the very day that answer was due, they responded to my FOIA request rather than answering the lawsuit as agreed upon. How special for IDPH to provide me a document that they claimed was the source data for the pie chart creation almost a year after I asked for it.
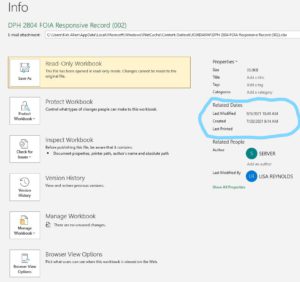
The first huge red flag was the data found in the file they provided. It reflects the document they provided me was created on 7/20/2021 and then modified on 9/9/2021, the day their answer to our FOIA lawsuit was due and the day they answered my FOIA request. This raises concerns considering the claimed source data document was created 10 months after the pie chart was published.
The second huge red flag, the claimed source data reflects a total of 768 cases. Considering the pie chart said the data is since July 1, 2020, we find it very strange that the claimed source data only had 768 cases. We had more cases on July 1, 2020, than the source data claims but more importantly, if the pie chart represents the cases “since” July 1, 2020, and the PowerPoint presentation says its a Situational Update September 16, 2020, someone is missing a ton of numbers.
Total COVID cases in Illinois between July 1, 2020, and September 16, 2020, was 122,966, which was obtained by simply adding each days case count published by (IDPH)
So what is the public to believe?
- Did IDPH actually figure out a way to identify where a person contracted COVID 19 to a point they can publish a pie chart as they did?
- Was the pie chart a true representation of cases since July 1, 2020, as claimed? Remember, there were more cases on that one day than the source data total reflects.
- Why was the source data document withheld for 10 days shy of a full year and only produced after being sued under our FOIA law?
- Why was the source data document created almost a year “after” the production of the pie chart?
In short, the numbers do not add up!
We have filed another FOIA for source data except this one is for the source data used to create the source data document they created almost a year after my original FOIA request. At some point, the public must be informed how they isolated specific case locations for COVID infections.
You decide, can you believe what you are being told?
You can download the claimed source data at this link or view below.
DPH 2804 FOIA Responsive Record (002)


12 Comments
PK
Posted at 18:48h, 03 OctoberI’d like to include IDPH’s recent press release about the first human case of rabies since 1954, which also made the big media press, in the reasoning for continued distrust of the agency. Evidently, IDPH delayed the press release in order to coincide with World Rabies Day…an example of IDPH putting a bureaucratic selfie in front of a prompt release.
GW ONE
Posted at 08:53h, 21 SeptemberI agree that Illinois’ Governor is not too bright, but very dangerous. But remember some of the dumbest voters in Illinois elected this guy. His form of governing is tyrannical, just like Biden’s.. Illinois is weak and financially bankrupt.
The same holds true at the federal level. Looks like the beginning of the end for individual freedom in America.
Tony
Posted at 23:14h, 20 SeptemberI remember early this year during one of gov Jabba’s covid update pressers, he was asked and explained “what is a covid case”.
The explanation was, a test taken is considered a case. There was no followup about revising numbers down after positives and negatives are determined. In a rational world that should be assumed. But the politique in Illinois haven’t treated much of this rationally.
Yes delta numbers are putting positives up….but higher than this time last year when vaccines weren’t a thing? This would logically mean either the vaccines don’t work, or the dead are voting in covid elections. Being in Illinois, I’m inclined to believe the latter.
PK
Posted at 18:52h, 20 SeptemberA while back Illinois Leaks published an article containing the Governor’s SEI filing with the Secretary. on a standard SEI form.
The Secretary’s SEI standard form contains general instructions. “Do not list debt instruments” is part of those general instructions. Yet, the Governor listed a debt instrument on his SEI form filing. It’s curious that Salt Lake City Utah would appear on the IDPH document here with the news article given that the debt instrument shown on the Governor’s SEI filing is listed as a loan from United Way of Salt Lake City.
Daniel L Sleezer
Posted at 11:12h, 19 SeptemberThanks Kirk for the updated link that shows their “tabulation” of the 768 cases.
Then my other comments are appropriate, “If that is the number they say the pie chart is based on then I say “How is the pie chart meaningful when based on such a small sample!” Even more important I do not see a “entry field” in the case documentation document (neither Batch Upload or Requisition! Am I missing something?” I do NOT see any field called “Setting Location” on the Requisition form so how/where did they get this information???
PK
Posted at 12:58h, 19 SeptemberThe pie chart is not very meaningful. As a graphical form, it represents the contact tracing data the state expended a lot of resources to collect.
A pareto diagram would communicate the same data much more effectively. In quality system management circles where the utilization of data and non-political science are organizational values, the pareto chart is far preferred. Honestly, IDPH’s communicating the contact tracing data on a pie chart appears to have been done in poor taste.
Daniel Sleezer
Posted at 12:28h, 20 SeptemberAgreed, as with most things, the state government employees were/are way over their heads. No comparison to employees in the Private sector. Thanks for what you two are doing!
PK
Posted at 21:11h, 18 SeptemberCongratulations on your FOIA lawsuit. Evidently, the Illinois Department of Public Health isn’t too concerned about being transparent or reliable. Unfortunately, it’s becoming increasingly difficult to maintain a healthy skepticism about the information promulgated by the Illinois Governor and certain administrative agencies of his office, IDPH being one of several others.
Frank Miller
Posted at 16:25h, 18 SeptemberIts all been a pack of lies from the beginning.
“Starting in February and March(2020), I began writing down and looking at the numbers published by the Centers For Disease Control, and comparing them to previous years. I was writing down the numbers from the first week of the year, and comparing those numbers to the previous week in 2019. And after I had done this for 2 or 3 months, I noticed that someone had been doing the same thing, only more thoroughly going back several decades. What I was seeing was a sharp drop in the weekly mortality, referring to the previous year. A sudden drop of 10 to 15% from last fall. And I couldn’t find any historical precedent. And this person, Joe Hoft, he did it for previous decades and came up with the same results.
The mortality peak last fall started in a steep rise exactly like every preceding year with the winter pneumonia deaths. But then suddenly around January 1st, there was a crash in the deaths all around the United States. People were dying less often from all causes. And that went on through March, there was this historically unique mortality curve. And then suddenly the first week of April, all of those missing deaths reappear in a gigantic un-historical peak, which they called the Covid death peak. And basically there is no way that can happen. You just can’t get a historical collapse of total mortality all around the country that way. The only way a criminal prosecutor could interpret it would be that someone was fiddling with the numbers, with foreknowledge that they were going to want a lot of deaths to report. So they trimmed impossibly the total mortality to have a big pile of deaths to report in April.” – Dr. Ray Peat
Daniel Sleezer
Posted at 15:27h, 18 SeptemberI read your article a couple of times and looked at the PowerPoint presentation, but I couldn’t find the data behind your comment, “The second huge red flag, the claimed source data reflects a total of 768 cases. Considering the pie chart said the data is since July 1, 2020, we find it very strange that the claimed source data only had 768 cases.” If that is the number they say the pie chart is based on then I say “How is the pie chart meaningful when based on such a small sample!” Even more important I do not see a “entry field” in the case documentation document (neither Batch Upload or Requisition! Am I missing something?
Kirk Allen
Posted at 16:22h, 18 SeptemberLinks to the source data correted.
Tracey B
Posted at 15:11h, 18 SeptemberI have not believed what Illinois politicians have said since 1987, I was entering my senior year in HS.